28 Aug

Long-term view shows Toronto and Vancouver home prices remain elevated despite recent declines

General

Posted by: Dean Kimoto

Despite detached home prices in Toronto and Vancouver posting year-over-year declines in the first half of the year, a longer-term view shows prices are still elevated, and in many cases higher compared to two or three years ago.

In its Hot Pocket Communities Report released Tuesday, RE/MAX found that detached homes in nearly 93% of the 82 districts it analyzed in both cities—which included downtown neighbourhoods and exurbs—were cheaper in the first half of 2023 compared to the previous year.

The exact amount varied between as little as 1.5% in West Vancouver to a whopping 25.6% in the Toronto exurb of Brock.

“Anxious homebuyers were quick to identify the bottom of the market and jumped in with both feet in the second quarter of the year,” Christopher Alexander, president of RE/MAX Canada, said in a statement.

RE/MAX said the easing of home prices was the biggest driver of buying activity in the first half of 2023, especially for existing homebuyers looking to upgrade their current residence.

Home prices remain elevated from a historical context

However, historical RE/MAX data show that despite the recent price drops, valuations remain on par with—or still above—pre- and early-pandemic prices.

In Toronto, prices in the district encompassing the Don Valley Village and Henry Farm neighbourhoods—among the cheapest in the downtown core—dropped by 10.8% to nearly $2 million in 2023. In the previous year, prices in the district had jumped by 17.4%, from $1.87 million to $2.1 million.

Vancouver East saw an 8.1% price drop in 2023, but that followed last year’s whopping 17.3% price gain.

And when it comes to towns outside of Toronto and Vancouver, the situation is even more stark.

In the Whistler/Pemberton area, outside of Vancouver, detached home prices declined 24.8% between 2022 and 2023, according to RE/MAX data. However, they also rose by 39.3% the previous year, more than cancelling out any benefits from this year.

Detached home prices in Orangeville, outside of Toronto, dropped by 14.3% in 2023, but they had shot up 26.47% the previous year.

In other words, prices for detached homes in these neighbourhoods largely haven’t declined over time.

“When we start to compare them over three years, we see virtually no price reduction because of what pricing was in 2020-2021 to where it is today,” Elton Ash, executive vice-president of RE/MAX Canada, told CMT in an interview. “Ultimately, if you purchased a home prior to 2020 and you sell today, you’re likely going to sell for higher than what you paid for it.”

The impact of higher rates and low supply

RE/MAX cites a lack of housing supply as the largest factor driving affordability issues today.

It says that nine out of the 16 districts it surveyed reported inventory shortages. This included the Gulf Islands and Whistler/Pemberton, where new listings are down by nearly 43% and 23%, respectively.

Ash says homebuilders are slowing their construction projects largely because of higher interest rates, inflation and uncertainty around carrying costs, not to mention buyer uncertainty.

Potential buyers are staying in their homes unless they absolutely need to move, which then reduces demand for new houses to be built. “That then becomes a self-fulfilling cycle,” Ash says. “You can’t get increased inventory if people just aren’t going to move.”

But the housing inventory shortage isn’t new. In 2022, the Canada Mortgage and Housing Corporation (CMHC) concluded that developers would need to build 3.5 million more housing units by 2030 than they normally would to make housing more affordable for the average Canadian buyer.

Ultimately, Ash doesn’t see housing affordability relief in the near term for prospective buyers looking to buy in the greater Toronto or Vancouver markets.

Where the housing market goes from here

With interest rates at historic highs, and the potential for them to rise further, Ash says he expects the market to be muted throughout the winter. But he doesn’t expect that will last.

Assuming interest rates remain under control and the Bank of Canada doesn’t increase interest rates beyond September, Ash expects the spring of 2024 to be a repeat of last spring.

Pent-up demand and higher buyer confidence, along with a stable interest rate environment, could see a return to 2023’s market conditions, he says. That ultimately means higher overall house prices, especially if developers don’t pick up the pace—and anything they do start this year won’t be ready for some time.

“I don’t see inventory increasing a great deal,” Ash says. “I do see buyer demand increasing. So, therefore, pricing will start to edge up next spring.”


This article was written for Canadian Mortgage Trends by:

23 Aug

Opinion: How to bridge the housing affordability gap for a generation without a home

General

Posted by: Dean Kimoto

Over the next few days, the new federal cabinet will gather in P.E.I. for their summer retreat. This is their first opportunity to get together and set priorities ahead of the return to Parliament in mid-September.

As they work to address the pressing issues of “making life more affordable” and “building more housing,” we ask that they keep front of mind how their decisions will impact an entire generation of Canadians and their dream of homeownership.

The demographics of Canadians impacted by the rising cost of housing have shifted recently. It now includes young middle-class professionals and young dual-income families living and working in urban centres. These are groups that in previous generations would be buying their first home but are now unable to do so.

It is not that the dream of homeownership is just further down the line, but that it feels completely unattainable.

A growing sense of hopelessness

Talking to peers in Vancouver, Calgary, Toronto and Ottawa, there is a shared sense of hopelessness in seeing a path to owning a home. It is a national issue where there is opportunity for the federal government to take a leading and convening role. It is encouraging to see a new housing minister in Sean Fraser and a renewed focus on addressing housing affordability.

Urban millennials are a key voter demographic that the Liberals have looked to over the past eight years and undoubtedly will in the next election. The current state of disillusionment and apathy within this group is palpable when it comes to housing affordability.

These sentiments can have the power to keep voters home on election day or even drive some to a populist alternative.

Whether it is record-high home prices leading to an insurmountable down payment or two additional interest hikes this summer further increasing mortgage costs, housing has not been this expensive in recent memory. Higher mortgage costs have been a key contributor to Canada’s stubborn inflation, with an increase from June’s 2.8% to 3.3% in July.

At the same time, rents are up significantly, eating into potential savings for a first home. The average monthly rent for a one-bedroom in Toronto is now more than $2,600 a month, up over 11% from last year. Vancouver is averaging $3,000. Even in Calgary, which traditionally has been immune to the high housing costs, one-bedroom rent is now at $1,800 a month, up 18% year-over-year.

Market conditions as they are mean that unless you have wealthy parents or an inheritance to help with a down payment, there is little hope of getting into a home, townhouse or even a one-bedroom condo.

Potential solutions

So, what can be done? One possible measure is a commitment from the most recent Liberal election platform, which is also supported by their opposition across the floor.

The federal government could increase the insured mortgage cut-off from $1 million to $1.25 million, and index it to inflation to better reflect today’s housing prices.

Why is this relevant? The average price of a home in the country’s largest centres, both in Greater Vancouver and Toronto, is now over $1.1 million. Any home over $1 million does not qualify for mortgage insurance and therefore requires a 20% down payment. Enacting this platform commitment would help more first-time homebuyers to afford a down payment.

In recent public opinion polling from Abacus Data measuring the top three issues facing Canadians, housing affordability and accessibility ranked third, ahead of the economy, and following only the rising cost of living and healthcare.

The government has the opportunity to reflect an understanding of the pressure the current market and economic conditions are putting on young Canadians hoping to buy a home someday and establish their lives.

Policies and messaging can benefit from empathizing with those millennials feeling this in their everyday lives.

This was written for Canadian Mortgage Trends by:


21 Aug

Choosing Your Ideal Payment Frequency

General

Posted by: Dean Kimoto

Your payment schedule is the frequency that you make mortgage payments and ranges from monthly to bi-monthly, bi-weekly, accelerated bi-weekly or even weekly payments. Below is a quick overview of what each of these payment frequencies mean:

Monthly Payments: A monthly payment is simply a single large payment, paid once per month; this is the default that sets your amortization. A 25-year mortgage, paid monthly, will take 25 years to pay off but includes the added burden of one larger payment coming from one employment pay period. With this payment frequency, you make 12 payments per year.

Example: $750k mortgage, 3-year fixed rate, 5.34%, 30-year amortization you would have a monthly payment of $4,156.19. No term savings; no amortization savings.

Bi-Weekly Payments: A bi-weekly mortgage payment is a total of 26 payments per year, calculated by multiplying your monthly mortgage payment by 12 months and divided by the 26 pay periods.

Example: $750k mortgage, 3-year fixed rate, 5.34%, 30-year amortization you would have a bi-weekly payment of $1,915.98 with term savings of $177 and total amortization savings of $1,769.

Accelerated Bi-Weekly Payments: An accelerated bi-weekly mortgage payment is also 26 payments per year, but the payment amount is higher than a regular bi-weekly payment frequency (take the monthly payment, divide by two, then multipy by 26.  Compared to regular bi-weekly this adds two extra bi-weekly payments per year). Opting for an accelerated bi-weekly payment will not only pay your mortgage off quicker, but it’s guaranteed to save you a significant amount of money over the term of your mortgage. This frequency also allows the mortgage payment to be split up into smaller payments vs a single, larger payment per month. This is especially ideal for households who get paid every two weeks as the reduction in cash flow is more on track with incoming income.

Example: $750k mortgage, 3-year fixed rate, 5.34%, 30-year amortization you would have accelerated bi-weekly payments of $2,078.10 with term savings of $1,217 and total amortization savings of $145,184. Plus, you would save 4 years, 12 months of payments by reducing scheduled amortization.

Weekly Payments: Similar to monthly payments, your weekly mortgage payment frequency is calculated by multiplying your monthly mortgage payment by 12 months and dividing by 52 weeks in a year. In this case, you would make 52 payments a year on your mortgage.

Example: $750k mortgage, 3-year fixed rate, 5.34%, 30-year amortization you would have weekly payments of $957.50 with term savings of $253 and total amortization savings of $2,526. You can move to accelerated weekly payments to save even more!

Prepayment Privileges: In addition to fine-tuning your payment schedule, most mortgage products include prepayment privileges that enable you to pay up to 20% of the principal (the true value of your mortgage minus the interest payments) per calendar year. This can help reduce your amortization period (the length of your mortgage).

By exercising your prepayment privileges, you can take time off your mortgage. For instance:

  • Extra $50 bi-weekly is $32,883 total savings and an additional 1 year, 2 months time saved
  • Extra $100 bi-weekly is $62,100 in total savings and an additional 2 years, 3 months time saved on your mortgage
  • Extra $200 bi-weekly is $111,850 in total savings and an additional 4 years, 1 month of time saved on your mortgage.

Understanding the different payment frequencies can be key in managing your monthly cash flow. If you’re struggling to meet a large payment, breaking it up can be effective; while the same can be true of the opposite. Individuals struggling to make a weekly or bi-weekly payment, may benefit from one monthly sum where they have time to collect the funds.

Contact a Dominion Lending Centres mortgage expert for more information or download our My Mortgage Toolbox app from Google Play or the Apple Store and check out the different payment calculators!

Published by my DLC Marketing Team.

17 Aug

Higher interest rates put a chill on Canada’s housing markets in July

General

Posted by: Dean Kimoto

Home sales and prices continued to ease in July following the two latest rate hikes from the Bank of Canada.

On a seasonally adjusted basis, home sales fell 0.7% from June to July, according to the latest monthly data from the Canadian Real Estate Association. This marks the first monthly contraction in six months.

While sales of existing homes were up in five of the 10 provinces, including Saskatchewan (+9%), Quebec (+5.1%) and Alberta (+4%), the declines in B.C. (-2.6%) and Ontario (-5.5%) were enough to reverse the upwards trend seen in recent months.

Calgary remained a notable exception, where home sales are up 9% since the Bank of Canada resumed its rate hikes.

“With the growing impact of interest rate hikes and our expectation for a slowing labour market, the real estate market could continue to lose momentum in the months ahead,” noted National Bank’s Daren King.

King added that the record demographic growth Canada is experiencing is helping to prevent a “significant” drop in sales.

National average price down 18% from peak

CREA reported that the national average home price (not seasonally adjusted) continued to fall in July to $668,754. While that’s up 6.3% compared to a year ago, it’s down over 18% from the peak reached in February 2022 of $816,720.

“Following a brief surge of activity in April, housing markets have settled down in recent months, with price growth now also moderating with its usual slight lag,” said Shaun Cathcart, CREA’s Senior Economist.

“Sales and price growth are already showing signs of tapering off further in August in response to the Bank of Canada’s mid-July rate hike and messaging regarding above-target inflation for longer than previously expected,” he added. “We’re probably looking at another round of ʻback to the sidelines’ for some buyers until there’s a higher level of certainty around interest rates going forward.”

Cross-country roundup of home prices

Here’s a look at select provincial and municipal average house prices as of July.

Location Average Price Annual price change
B.C. $966,181 +5.4%
Ontario $856,269 +3.2%
Quebec $492,190 +2.6%
Alberta $452,387 +4.1%
Manitoba $352,352 -0.3%
New Brunswick $292,300 -1.3%
Greater Vancouver $1,210,700 +0.5%
Greater Toronto $1,161,200 +1.3%
Victoria $887,900 -4.7%
Barrie & District $820,900 -4.8%
Ottawa $650,200 -3.1%
Calgary $551,300 +5.6%
Greater Montreal $520,000 -1.5%
Halifax-Dartmouth $529,900 +6.4%
Saskatoon $384,200 +0.3%
Edmonton $375,100 -6.2%
Winnipeg $347,200 -1.1%
St. John’s $332,800 +2.2%

*Some of the movements in the table above may be somewhat misleading since average prices simply take the total dollar value of sales in a month and divide it by the total number of units sold. The MLS Home Price Index, on the other hand, accounts for differences in house type and size and adjusts for seasonality.

Resale market is returning to balance

CREA also reported that the number of newly listed homes continued to increase for the fourth straight month, rising 5.6% from June. “Building on gains of 2.8% in April, 7.9% in May, and 5.9% in June, new listings have gone from a 20-year low in March to closer to (but still below) average levels by mid-summer,” CREA noted.

This caused the sales-to-new listings ratio to ease to 59.2%, down from 63% in June and a peak of 68% in April. Supply also ticked up to 3.1 months of inventory from 3 in June.

“With sales dipping and resale supply on the rise, markets are moving towards being more balanced,” said TD Economics’ Rishi Sondhi.

National Bank’s Daren King also pointed to a rise in cancelled listings in the month, which he said indicated a “loss of momentum in the real estate market.” He said it’s “a sign that some sellers are discouraged by recent interest rate hikes.”

Looking ahead, real estate markets are expected to face continued headwinds from elevated interest rates, even if the Bank of Canada remains on hold from here.

BMO’s Robert Kavcic notes that interest rates are likely to remain at current elevated levels into next year, which will continue to act as a headwind for the housing market.


This article was written for Canadian Mortgage Trends by:

14 Aug

Home Renovations – Reality vs. Television

General

Posted by: Dean Kimoto

Home Renovations – Reality vs. Television.

Watching home renovation shows is inspiring, often providing us with ideas for our own spaces. However, there is a bit of a downside when it comes to these shows – they can be misleading when it comes to the renovation process.

While we may want to recreate something from one of these shows, without knowing all of the ins and outs, you could be starting a project you’re not ready for! In order to sort out what is real and what is television magic, we have broken down some of the components that go along with a renovation.

Budget & Financing

When it comes to most home renovation shows, there is little to no discussion regarding finances. In reality, if you’re looking to renovate your home you would want to discuss with your mortgage broker or a mortgage expert from Dominion Lending Centres to determine your options.

Some of the ways that you can finance a renovation include:

  1. Mortgage Refinancing: This option will allow you to borrow up to 80% of your home’s appraised value (less any outstanding mortgage balance). Refinancing your mortgage (if approved) will provide you to access funds immediately and tends to have lower interest rates than a standard credit card or personal loan. This is best suited to large-scale renovations or remodels. You will want to refinance at the end of the mortgage term whenever possible to avoid breaking your mortgage and owing penalties.
  2. Purchase Plus Improvements Mortgage: This is a great option if you haven’t yet bought that home and will allow you to finance your renovation at the time of purchase. This type of mortgage is available to assist buyers with making simple upgrades, not conducting major renovations where structural modifications are made. Simple renovations include paint, flooring, windows, a hot-water tank, a new furnace, kitchen updates, bathroom updates, a new roof, basement finishing, and more. Depending on your mortgage, the Purchase Plus Improvements (PPI) product can allow you to borrow between 10% and 20% of the initial value for renovations.
  3. Financing Improvements Upon Purchase: Similarly to Purchase Plus Improvements, this option allows you to finance your renovation project at the time of a new purchase by adding the estimated costs to your mortgage with CMHC Mortgage Loan Insurance. You can obtain financing with only a 5% down payment for both the purchase of your home and the renovations for up to 95% of the value after renovations! Plus, there are no additional fees or premiums and you can earn added rebates for energy-saving renos.
  4. Line of Credit or Home Equity Loans: Lastly, you always have the option of utilizing a secured line of credit or home equity loan to pay for your renovation. Securing your renovation loan against the equity in your home can typically be up to 80% of the property value; accessible at any time. This will typically provide lower interest than non-secured financing and allows you to access funds at any time.

Once you have your source of renovation financing, you need to create a budget. On television, it is very hard to determine whether a renovation budget that is listed is accurate. In fact, in some cases the network or show itself even adds to the budget behind the scenes! As viewers, we are simply not aware of what has been factored into those numbers by the television producers such as design fees, permits, labour, material costs, promotional giveaways, etc.

Fortunately, when it comes to reality, you can easily create a realistic budget for your renovation by simply doing some research and requesting quotes. Working with a professional contractor in these cases is crucial to ensure all the work done is to code and to avoid any surprises down the line. A professional can also help you create a detailed budget and timeline for your project so you know what to expect. During all stages of the renovation from picking out paint and new tile to labour costs, be sure to consult your budget. You don’t want to be partway through your renovation only to find out that you’ve run out of money due to making changes or selecting more expensive materials!

Renovation Timeline

Perhaps one of the least realistic aspects of home renovation shows is the timeline. It can seem like just a few short weeks to re-do your entire kitchen, but in reality, that timeline is often stretched.

Working with your contractor to create a realistic timeline based on your goals will help make the process less stressful and ensure you know what you’re getting into BEFORE you start.

Keep in mind, just because you’re ready to renovate, that doesn’t mean a contractor will be available. You may also run into snags such as material shortages or other issues so keep that in mind when you are planning out your timeline.

Planning & Design

When it comes to home renovation television, there is often an interior designer who comes in and makes decisions without the clients; in reality, that is not the case. When it comes to a real-life renovation, all the changes would be well-documented and planned out in advance with the clients (or by the client). In addition, unlike television shows that don’t show certain aspects, you will need to ensure you get building permits and inspections done throughout your renovation. While it can be time-consuming, this is extra important to ensure that your renovation is legal and therefore covered by insurance should anything happen.

While doing a home renovation in real life is different from television, with the right planning and support team for financing and contracting, you can bring your vision to life! Contact your Dominion Lending Centres mortgage expert to get started.

Published by my DLC Marketing Team July 25, 2023

8 Aug

Real estate markets defy rate hikes: annual growth in activity persists, but there are signs of a cooling ahead

Latest News

Posted by: Dean Kimoto

Real estate markets in the country’s largest metro areas remained relatively strong in July despite the Bank of Canada’s most recent rate hikes.

Data from some of the key real estate boards show continued year-over-year growth in activity and continued upward momentum in prices.

In Toronto, sales posted a 7.8% year-over-year gain, while in Vancouver they were up nearly 29%.

However, Andrew Lis, the Real Estate Board of Greater Vancouver’s director of economics and data analytics, said part of the strength is due to weaker sales a year ago as interest rates were starting to rise.

“Last July marked the point when the Bank of Canada announced their ‘super-sized’ increase to the policy rate of one full per cent, catching buyers and sellers off guard, and putting a chill on market activity at that time,” he noted.

Still, Lis notes that the current strength is against the backdrop of borrowing rates that are much higher compared to a year ago. “Despite borrowing costs being even higher than last July, sales activity surpassed the levels we saw last year, which I think says a lot about the strength of demand in our market and buyers’ ability to adapt to and qualify for higher borrowing costs,” he continued.

Signs of cooling ahead

On a monthly basis, sales in most markets were down, including in Vancouver (-3%), Toronto (-8.8%), while price gains moderated.

Pressure eased on prices thanks in part to an increase in supply as sellers have started listing homes in greater numbers, particularly in Ontario and British Columbia.

“If sustained, we would expect price gains to continue moderating in the coming months,” noted RBC economists Robert Hogue and Rachel Battaglia.

“Signs of cooling activity in some of Canada’s largest markets are consistent with our view that the spring rebound was premature, and will taper off further amid high interest rates, ongoing affordability issues and a looming recession,” they added. “We think the path ahead is more likely to be slow and bumpy, with the recovery gaining momentum when interest rates come down—a 2024 story.”

Regional housing market roundup

Here’s a look at the July statistics from some of the country’s largest regional real estate boards:

QUICK LINKS:

*********

Greater Toronto Area

July 2023 YoY % Change
Sales 75,250 +7.8%
Benchmark price (all housing types) $1,118,374 +4.2%
New listings 13,712 +11.5%
Active listings 15,371 +0.3%

“Home sales continued to be above last year’s levels in July, which suggests that many households have adjusted to higher borrowing costs. With that being said, it does appear that the sales momentum that we experienced earlier in the spring has stalled somewhat since the Bank of Canada restarted its rate tightening cycle in June,” said TRREB President Paul Baron.

“Compounding the impact of higher rates has been the persistent lack of listings for people to purchase compared to previous years,” he added.

Source: Toronto Regional Real Estate Board (TRREB)


Greater Vancouver Area

July 2023 YoY % Change
Sales 2,455 +28.9%
Benchmark price (all housing types) $1,210,700 +0.5%
New listings 4,649 +17%
Active listings 10,301 -4%

“While sales remain about 15% below the 10-year average, they are also up about 30 per cent year-over-year, which is not insignificant,” said Andrew Lis, REBGV Director of Economics and Data Analytics.

“Looking under the hood of these figures, it’s easy to see why sales are posting such a large year-over-year percentage increase,” he added. “Last July marked the point when the Bank of Canada announced their ‘super-sized’ increase to the policy rate of one full per cent, catching buyers and sellers off guard, and putting a chill on market activity at that time.”

Source: Real Estate Board of Greater Vancouver (REBGV)


Montreal Census Metropolitan Area

July 2023 YoY % Change
Sales 3,098 +1%
Median Price (single-family detached) $555,000 +1%
Median Price (condo) $395,000 0%
New listings 4,354 -9%
Active listings 14,820 +20%

“After a disappointing month of June, transaction activity is picking up in the Montreal CMA. For the first time since the summer of 2021, it is the Island of Montreal that is pushing activity in the metropolis, driven by sales of small income properties and single-family homes,” said Charles Brant, Director of the QPAREB’s Market Analysis Department.

“Clearly, some buyers are less affected by the rise in interest rates. The majority of buyers currently in the market can count on income or equity from their real estate holdings, with values compared to last year,” he added. “The many newcomers with immigration status allowing them to buy a property in Quebec are also joining the ranks of this category of buyers with good purchasing power.”

Source: Quebec Professional Association of Real Estate Brokers (QPAREB)

Calgary

July 2023 YoY % Change
Sales 2,647 +17.7%
Benchmark price (all housing types) $567,700 +5.7%
New listings 3,247 +2.2%
Active listings 3,488 -34.8%

“Continued migration to the province, along with our relative affordability, has supported the stronger demand for housing despite higher lending rates,” said CREB Chief Economist Ann-Marie Lurie.

“At the same time, we continue to struggle with supply in the resale, new home and rental markets resulting in further upward pressure on home prices,” she added.

Source: Calgary Real Estate Board (CREB)


Ottawa

July 2023 YoY % Change
Sales 1,658 +11%
Average Price (residential property) $746,445 -4%
Average Price (condominium) $448,380 +2%
New listings 2,758 -14%

“Both transactions and average prices are up from last July indicating consumers remain confident in the market notwithstanding the two recent quarter-percent interest rate hikes by the Bank of Canada,” said OREB President Ken Dekker.

“We’re only a month into the third quarter, but based on July’s positive indicators, we are likely to see solid year-over-year results in the second half,” he added.

Source: Ottawa Real Estate Board (OREB)


This article was written for Canadian Mortgage Trends by:

31 Jul

Renting vs. buying in today’s market: how monthly payments compare

General

Posted by: Dean Kimoto

In addition to the stats on renting vs buying there’s some great economic data following!

This article was written by Steve Huebl for Canadian Mortgage Trends: Renting vs. buying in today’s market: how monthly payments compare

A new study has found the cost of renting vs. buying comparable housing in select Canadian markets is nearly on par.

In fact, the difference between renting and buying was less than $500 per month in 11 different markets, according to the report from Zoocasa.

“Though no market is more affordable to buy in than rent, there are several markets where the rental and mortgage payments are similar, though these are all outside of Ontario and British Columbia,” the report notes.

For example, in Winnipeg the average monthly rent is $1,475, while the average mortgage payment was calculated at $1,493, for a difference of just $18. Similarly in Quebec City and Regina, the Zoocasa report found average rents were just slightly more affordable, by $54 and $148, respectively, per month.

It’s important to note that the study didn’t factor in other costs such as utilities, maintenance or property taxes.

In other markets, the monthly cost between renting and owning was more drastic. The largest payment difference was found in Surrey, B.C., where the average mortgage payment was calculated at $2,639 more than the cost of renting. Similar large gaps were seen in the Ontario cities of Burlington and Brampton.

The results were in contrast to a 2021 Royal LePage survey that found, on average, the cost of homeownership was actually less than the cost of renting a comparable housing unit. At that time, of course, homeowners were benefiting from record-low interest rates.

Zoocasa said the average rental rates were sourced from Rentals.ca, while mortgage payments were based on average house price data from the Canadian Real Estate Association and calculated assuming a 20% down payment, and a 5.04% rate amortized over 30 years.

Courtesy: Zoocasa

Other mortgage and real estate stories…


Bank of Canada expected to keep benchmark rate at 5%

The Bank of Canada’s benchmark interest rate is expected to spend the remainder of the year at its current 22-year high of 5.00%, according to a median of responses from market participants.

The findings were released in the Bank of Canada’s second-quarter Market Participants Survey, which surveyed 30 financial market participants between June 8 and 19, 2023.

Asked for their forecast for the Bank of Canada’s policy interest rate, respondents were near-unanimous in believing the policy rate will remain at 5% through the end of the year.

That’s contrary to current bond market pricing, which currently sees a near 80% chance of one more quarter-point rate hike at the Bank’s September meeting.

Most survey respondents expect rates to fall to 4.75% by March 2024, and believe the benchmark rate will end 2024 at 3.50%. By the third quarter of 2025, a median of responses from participants see the Bank of Canada cutting rates further to 2.50%.

The respondents pointed to higher interest rates as the top risk facing economic growth in Canada, followed by tighter financial conditions and a decrease in purchasing power.

A majority of respondents also now believe Canada will skirt a recession and see annual gross domestic product growth remaining positive throughout both 2023 (+0.7%) and 2024 (+1.2%). In the first-quarter survey, the median forecast was for slightly negative growth in 2023.

On inflation, the participants expect total CPI inflation to slow to 3% by the end of 2023 (up from 2.7% in the previous survey), easing further to 2.2% by the end of 2024 (unchanged from the Q1 survey).

Canadian job vacancy rate drops to two-year low

Canada’s job vacancy rate continued to trend down in May, reaching a two-year low.

Statistics Canada reported on Thursday that the number of unfilled positions fell to 759,000 in May, a decline of 26,000 from April. The declines were concentrated in Quebec (-10,800), Manitoba (-3,700) and Saskatchewan (-2,400).

This resulted in the job vacancy rate falling to 4.3%, down by 0.1% from the previous month. Compared to last year, the job vacancy rate is down by 1.5 percentage points.

The StatCan report shows the number of payroll employees rose by 129,900 in the month, led by gains in public administration (106,200) and healthcare and social assistance (+7,000).

Average weekly earnings were up 3.6% on an annual basis to $1,200.75. That’s up from the 2.9% pace reported in April.

U.S. Fed hikes interest rates

On Wednesday, the U.S. Federal Reserve raised its benchmark borrowing costs to the highest level seen in more than 22 years. The Federal Open Market Committee (FOMC) raised the fed funds rate to a target range of 5.25% to 5.5%. The midpoint of this range represents the highest benchmark rate level since early 2001.

Financial markets had largely expected this rate hike.

Fed Chairman Jerome Powell noted during a news conference that inflation has shown some moderation since the middle of the previous year, but still has a way to go to reach the Fed’s 2% target. Powell left open the possibility of maintaining rates at the next meeting in September, stating that future decisions would depend on carefully assessing incoming data and its impact on economic activity and inflation.

“It’s certainly possible we would raise (rates) again at the September meeting, and it’s also possible we would hold steady,” he said.

19 Jul

CPI Inflation Falls To 2.8%–Inside the BoC’s Target Range

General

Posted by: Dean Kimoto

Canadian inflation falls within Bank of Canada’s target range, but food and shelter costs remain high


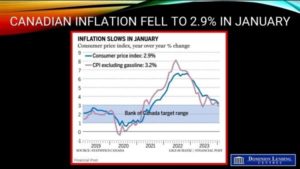
June inflation data released today by Statistics Canada showed that the Consumer Price Index (CPI) rose 2.8% year-over-year (y/y), slightly below expectations. This was the lowest CPI reading since February 2022.

The decline in inflation was mainly due to lower energy prices, which fell by 21.6% y/y. Without this decline, headline CPI inflation would have been 4.0%. The year-over-year decrease resulted from elevated prices in June 2022 amid higher global demand for crude oil as China, the largest importer of crude oil, eased some COVID-19 public health restrictions. In June 2023, consumers paid 1.9% more at the pump compared with May.

Food and shelter costs remained the two most significant contributors to inflation, rising by 9.1% y/y and 4.8% y/y, respectively. Food prices at stores have risen nearly 20% in the past two years, the most significant rise in over 40 years. Shelter inflation rose slightly from 4.7% y/y in May.

The largest contributors within the food component were meat (+6.9%), bakery products (+12.9%), dairy products (+7.4%) and other food preparations (+10.2%). Fresh fruit prices grew at a faster pace year over year in June (+10.4%) than in May (+5.7%), driven, in part, by a 30.0% month-over-month increase in the price of grapes.

Food purchased from restaurants continued to contribute to the headline CPI increase, albeit at a slower year-over-year pace in June (+6.6%) than in May (+6.8%).

Services inflation cooled to 4.2% y/y from 4.8% y/y in May. This was due to smaller increases in travel tours and cellular services.

The Bank of Canada’s target range for inflation is 1% to 3%. While June’s inflation reading was within the target range, it is still higher than the Bank would like. The Bank raised the overnight policy rate twice in the past two months to reduce the stickier elements of inflation.

There were signs of easing price pressures for consumer goods also. Durable goods inflation continued to cool to 0.8% y/y in June. Passenger vehicle prices rose slower in June (+2.4%) than in May (+3.2%). The year-over-year slowdown resulted from a base-year effect, with a 1.5% month-over-month increase in June 2022 replaced with a more minor 0.6% month-over-month increase in June 2023. This coincided with improved supply chains and inventories compared with a year ago. Household furniture and equipment was up only 0.1% y/y in June, down from a peak of 10.5% last June.

The June inflation data provides some relief to consumers, but it is clear that food and shelter costs remain a major concern. The Bank of Canada will closely monitor inflation in the coming months to see if it is on track to return to its 2% target. There is another CPI report before the Bank meets again on September 6th.

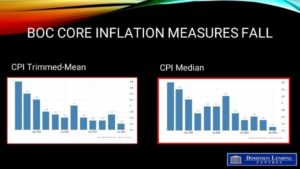
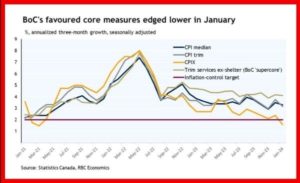
The Bank of Canada’s underlying inflation measures cooled further in May. CPI-trim eased to 3.7%y/y in June from 3.8% y/y in May, and CPI-median registered 3.9% versus 4.0% y/y in May. The chart below shows the closely watched measure of underlying price pressures, the three-month moving average annualized of the core measures of CPI. They continue to be just under 4%.

Canadian inflation continued to make encouraging progress in June. However, the cooling in headline inflation benefits from sizeable base effects due to the favourable comparison to high energy prices last June. The Bank of Canada (BoC) is watching its preferred core measures, which continue to show glacial progress.

Bottom Line

It takes time for the full effect of interest rate hikes to feed into the CPI. Mortgage interest costs will continue to rise as higher interest rates flow gradually through to household mortgage payments with a lag as contracts are renewed.

BoC Governor Macklem emphasized last week that the Bank has become worried about the persistence of underlying inflation pressures in the economy. The June inflation data likely provides some reassurance that things are moving in the right direction, but not fast enough for the Bank of Canada to let its guard down.

The BoC is facing a difficult balancing act. It needs to raise interest rates enough to bring inflation under control, but it also needs to be careful not to raise rates so high that it causes a recession. The next few months will be critical for the BoC as it assesses the risks of inflation and recession.

Please Note: The source of this article is from SherryCooper.com/category/articles/
19 Jun

Strong May Housing Market Likely Triggered Recent BoC Rate Hike

General

Posted by: Dean Kimoto

The Canadian Real Estate Association says home sales in May rose 5.1% month-over-month (m/m), adding to the 11.1% gain in April. This brought the year-over-year sales gain to 1.4%, The first y/y sales increase in almost two years. While spring home sales started booming (compared to the past year), the surprising 25 bps uptick in the Bank of Canada’s policy rate has no doubt dampened enthusiasm in June. Indeed, the strength in housing may have been the deciding factor in the Bank’s decision.

Sales were up in about 70% of all local markets, including Canada’s largest markets: the Greater Toronto Area (GTA), Montreal, Greater Vancouver, Calgary, Edmonton, and Ottawa.

New Listings

The number of newly listed homes was up 6.8% month-over-month in May, although the bigger picture is that new supply is still running at historically low levels.

With sales and new listings up by similar magnitudes in May, the sales-to-new listings ratio was 67.9%, little changed from 69% in April. The long-term average for this measure is 55.1%.

There were 3.1 months of inventory on a national basis at the end of May 2023, down from 3.3 months at the end of April and down more than an entire month from the most recent peak at the end of January. The long-term average for this measure is about five months.

The dearth of sellers could reflect the reluctance of existing homeowners to give up their low-rate mortgages.

Home Prices

The Aggregate Composite MLS® Home Price Index (HPI) climbed 2.1% on a month-over-month basis in May 2023 – a significant increase for a single month and on the heels of a similar gain in April. Once again, it was also very broad-based, with a monthly price increase between April and May observed in most local markets.

The Aggregate Composite MLS® HPI now sits 8.6% below year-ago levels, a smaller decline than in the first four months of this year. The second chart below shows that year-over-year price gains are posted at the national level and in BC, Alberta, and Nova Scotia. With the strength in the GTA, y/y prices are fast approaching positive territory.

Bottom Line

The rate hike by the BoC has spooked the housing market. Anecdotal evidence suggests that activity has slowed, and the demand for fixed-rate mortgages has surged. Many households now face higher monthly payments in the next two years. The Bank of Canada knows that and wants to see household spending slow from the rapid Q1 pace. Consumer confidence has risen sharply since March. But with household debt-to-income levels at near-record highs, the sensitivity to interest rates is extreme.

Ironically, just as the BoC raised rates again after months of no action, the Federal Reserve decided to pause rate hikes for the first time this cycle. US inflation peaked at over 9.1% and fell to 4.0% in May. While Canadian inflation topped at 8.1%, its most recent posting was 4.4% in April. May data for Canada will be released on June 27.

Traders are currently expecting one more rate hike in Canada this year. The idea that the Bank would cut rates any time this year has vanished. Most are betting the first rate cut is more likely to be in mid-2024. We have learned that uncertainty prevails, but I’d bet that we will not return to pre-Covid interest rates for a very long time.

Please Note: The source of this article is from SherryCooper.com/category/articles/
26 Apr

OSFI’s Annual Risk Outlook – Fiscal Year 2023-2024

General

Posted by: Dean Kimoto

Weakening Housing Markets Pose A Risk For The Canadian Economy

On April 18, Canada’s national banking regulator, the Office of the Superintendent of Financial Institutions (OSFI), released its second Annual Risk Outlook (ARO), outlining what it believes are the most significant headwinds facing the Canadian financial system – and what the regulator plans on doing about it.

According to the report, the severe downturn in real estate prices and demand following their significant rise during the pandemic was the most pressing issue. OSFI acknowledges that the housing market changed significantly over the past year, and house prices fell substantially in 2022. The regulator is preparing for the possibility that the housing market will experience continued weakness throughout 2023.

The report also highlights how the Bank of Canada’s rate hiking cycle has impacted borrowers’ ability to pay down mortgage debt, with the central bank increasing its benchmark cost of borrowing eight times between March 2022 and January 2023, bringing its Overnight Lending Rate from a pandemic low of 0.25% to 4.5% today.

Mortgage holders may be unable to afford continued increases in monthly payments or may experience a significant payment shock at the time of their mortgage renewal, leading to higher default probabilities. Given the considerable impact of real estate-secured lending (RESL) activities in the Canadian financial system, a housing market downturn remains a critical risk.

OSFI also highlights the dangers posed by more borrowers hitting their trigger rates; according to a National Bank study, eight in ten variable fixed-payment borrowers who took their mortgages out between 2020-2022 are impacted. Lenders have addressed this by extending the amortization period for affected borrowers, but OSFI says this is just a temporary solution.

Borrowers and lenders alike will need to pay the price in due course, as OSFI points out. The growth in highly leveraged borrowers increases the risk of weaker credit performance, potentially leading to more borrower defaults, a disorderly market reaction, and broader economic uncertainty and volatility.

These recent comments strengthen expectations that stricter mortgage rules could be in the cards before the year ends. Back in January, OSFI announced it was considering making tweaks to its Guideline B-20, which outlines borrowing and risk requirements for banks underwriting residential mortgages and qualification rules for borrowers, including the mortgage stress test.

OSFI may increase borrowers’ debt servicing ratio requirements, making it more challenging for those with larger debt loads to qualify for a mortgage. It is also considering limiting how many of these higher-leveraged borrowers banks can have in their portfolios, potentially leading to fewer borrowers making the cut at A-lenders and turning to the B-side and alternative mortgage market.

Finally, OSFI may change the threshold criteria for the mortgage stress test. Currently, borrowers must prove they can carry their mortgage at a rate of 5.25%, or 2% above the one they’ll receive from their lender, whichever is higher. However, following last year’s rapid rate increases, the 5.25% threshold has become obsolete, with all current market rates above 3.25%.

OSFI wrapped up consultations on these potential changes late last week and will release a report on its recommendations. Borrowers should keep an eye out for changes in the months to come.

Please Note: The source of this article is from SherryCooper.com/category/articles/